


Perhaps you’ve noticed that big wood-framed buildings are in
the news lately:
- The City of Portland granted a building permit for a 12-story cross-laminated timber (CLT) tower this year.
- SOM developed a “concrete-jointed timber frame” system which they say could be used to construct a 42-story tower.
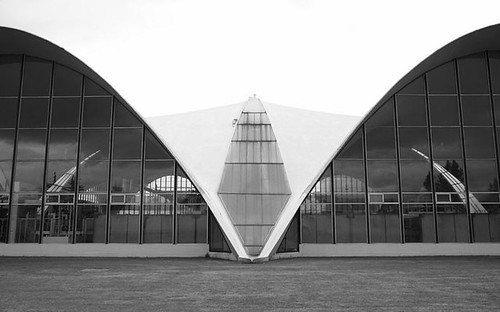
- The first large CLT building in Massachusetts opened at UMass Amherst this year, and it uses an innovative wood-concrete composite floor system (Figure 1).

Figure 1: Composite
Timber Slab at UMass Design Building
Wood is hot for good reason. Buildings account for nearly
40% of U.S. climate-altering carbon dioxide emissions, and about 20% of those
emissions are related to building construction and maintenance. Materials
matter, and wood structure usually has the smallest carbon footprint of any of
the primary structural materials.
The just-published ASCE report, Structural Materials and Global Climate,
explains why wood structure has such a low carbon footprint. When trees are
converted to structural framing, including sawn lumber and engineered products
such as laminated veneer lumber, glu-lam beams, and CLT, the carbon dioxide
that the trees metabolized into wood fiber is sequestered. As long as that wood
is protected from decay or combustion, that sequestered carbon will not
contribute to climate change. In contrast, the production of other structural
materials such as steel and concrete emits significant carbon dioxide
emissions.
Keep in mind that the carbon balance of living forests is
complex and not yet fully understood. Harvesting wood has carbon dioxide
emissions impacts that are not generally considered in life-cycle assessment such
as soil disturbance and burning of tree residue. Some studies show that poorly
managed forests actually emit more carbon dioxide when harvested than if they
had been left alone. Therefore it is good practice to specify lumber harvested
from sustainably managed forests.
Here is a simple example of how you can compare the climate
impact of different structural options. On a weight basis, the “embodied
carbon” in cold-formed steel framing is 2.28
lbs of CO2 per lb of steel, whereas the figure for sawn lumber
is only 0.15
lbs/lb. In and of itself, this information is not all that meaningful,
since steel is stronger than wood; we must look at “functional equivalency.”
So, let’s say you have a 12-foot span and want to use joists
at 16” o.c. The 2012 International Residential Code specifies that 2x8 SPF #2
at 16” o.c. can span 12’-3” (for the 10 psf DL, 40 psf LL case). The IRC table
for cold-formed steel joists calls for 800S162-33 under the same conditions.
Converting to psf of floor area, the wood framing is 1.7 psf and the steel
framing is 1.1 psf. In terms of carbon dioxide emissions, then, the wood option
is 0.25 psf and the steel option is 2.4 psf, nearly ten times higher (Figure 2).
In practice we should look at the entire building to account for all aspects of
the construction, including those that may vary between wood- and steel-framed buildings;
nevertheless, this simple comparison starts a compelling argument for the
climate benefits of wood construction.


